Hammer and Shooting Star are two popular candlestick patterns. Appearing on the chart, they precede a correction or trend reversal. These two patterns form at the local extremes of the price chart after a lengthy movement.
Hammer
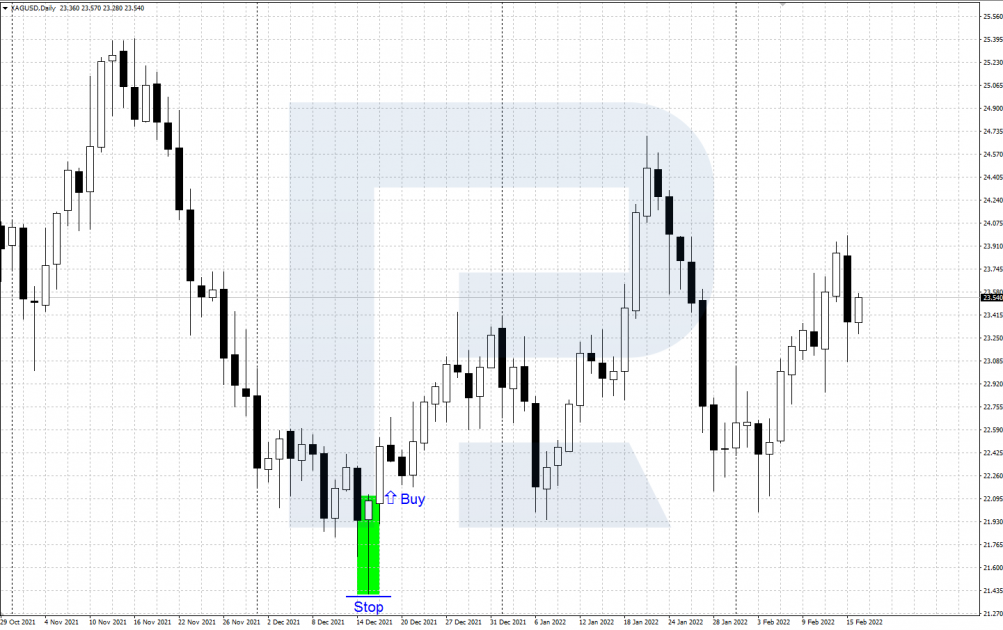
The Hammer pattern indicates a market reversal upwards and forms at the price lows after a descending price movement. The pattern looks like a candlestick with a small body and a long lower shadow, at least three times as large as the body.
The body of the candlestick closes near the highs, the upper shadow is tiny or lacking altogether. The candlestick may be of any colour, with or without a gap from the previous candlestick. A pattern with a white body will be a bit stronger. The candlestick resembles a hammer on a long handle, that is why the pattern got its name.
The Hammer only matters after a serious decline, when the market is oversold. In a downward movement, the bears bump at a strong support level that lets the bulls find a foothold and try to reverse the market upwards. The long lower shadow of the candlestick demonstrates the power of the bulls and their readiness to fight back.
If after the Hammer forms the bulls manage to hold the support level consisting of the pattern low and push the quotations upwards, renewing the high of the candlestick — then an upward correction becomes more possible, which means a good chance to buy. However, if the bears manage to drag the prices under the low of the candlestick, the signal to buy will be cancelled, so that the decline may continue.

What the Hammer pattern looks like on the chart
Shooting Star
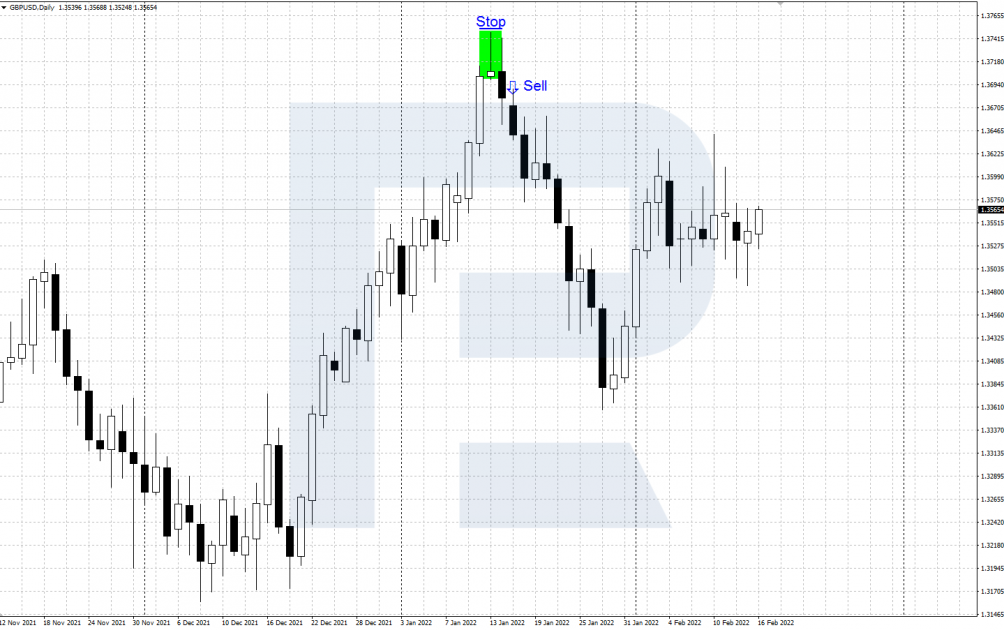
Shooting Star indicates a market reversal downwards, appearing at the highs of the price after an ascending movement. This pattern mirrors the Hammer: it consists of a candlestick with a small body and a long upper shadow, at least three times larger than the body.
The body closes near the lows, the lower shadow is small or totally lacks. The candlestick may be of any colour, with or without a gap from the previous candlestick. A pattern with a black body will be a bit stronger. This candlestick looks like a shooting star (a meteorite burning in the atmosphere) that leaves a long trail.
The pattern is significant only after a lengthy decline of the quotations, when the market is overbought. In an ascending movement, the bulls get stuck in a strong resistance level that gives the bears a chance to accumulate forces and push the price down. The long upper shadow of the candlestick demonstrates the power of the bears and their eagerness to reverse the market in their direction.
If after a Shooting star the bears manage to hold the resistance level formed by the high of the pattern, and push the quotations down, renewing the low — then the descending correction becomes more probable and a good chance to sale appears. However, if the bulls manage to raise the quotations above the high of the pattern, the signal to sell will be cancelled, and the upward movement may return.

What a Shooting Star pattern looks like on the chart
Trading the Hammer and Shooting Star
As long as these two are reversal patterns, they are to be looked for on the local lows and highs of the price chart in a descending or ascending trend, respectively. These patterns are not recommended for flats except for the cases when they confirm bounces off the borders of the price range.
The patterns are good for trading shares, commodity futures, Forex currencies, etc. They work on larger timeframes by themselves and can be useful for trading intraday when applied alongside tech analysis.
Hammer: signal to buy
- In a downward movement, a reversal Hammer pattern forms at the lows of the chart.
- After the candlestick closes and the quotations grow above its high, open a buying position.
- Place a Stop Loss under the low of the pattern. Take the profit at an important support/resistance level or Fibonacci lines.

Buying by a Hammer pattern
Shooting Star: signal to sell
- In an uptrend, the chart forms a Shooting Star reversal pattern at its highs.
- After a candlestick forms, and the quotations drop under its lows, open a selling position.
- Place a Stop Loss above the high of the candlestick and look for strong support/resistance/Fibonacci levels to Take your profit.

Selling by a Shooting Star
Supporting factors
The following factors make it more probable that the price will go by the signals:
- Price gaps.
- The colour of the candlestick body. The best Hammer has a white body and the best Shooting Star — a black one.
- Important support/resistance levels near the formed shadows of the candlesticks.
Closing thoughts
The Hammer and Shooting Star patterns form at the local extremes of the chart in a downtrend or an uptrend, respectively. They warn us of a possible correction or even a reversal.
For better trading, use these candlestick patterns alongside support/resistance levels from tech analysis.
If you want to know more about other candlestick patterns, read our another article in the Blog.
Candlestick Analysis on Forex: Main Principles, Application Options
--------------------
blog.roboforex.com/blog/2022/02/17/how-to-trade-hammer-and-shooting-star-candlestick-patterns/
 Make Money OnlineForexInvestingBitcoinVideosFinancePrivacy PolicyTerms And Conditions
