It is said that the best generals know when to go to war and when to avoid a battle. They know when they have a tactical or strategic advantage and when the odds are not in their favor. They would only go to war when they think they have a clear advantage and would rather make peace if they know they cannot win the war.
The same is true with trading. Great traders know when to trade and when to step away from the market. They know if the market conditions favor their style of trading or the market is too difficult for their style. Seasoned traders would step away from their desks and not trade if they know the market is not showing a clear opportunity. Some would sit on their desks the whole day and not take a single trade because they know the probabilities do not favor them.
Ichi Average Strength Forex Trading Strategy is a strategy that is designed to help traders identify and avoid choppy non-directional markets and trade only on markets that are showing a clear trending action. This gives traders a clear edge because they can now avoid low probability trades and take only high probability setups.
Usoho Ichi Average
Usoho Ichi Average is a technical indicator which is based on the Ichimoku Kinko Hyo indicator. It is a trend following indicator which provides a more complete picture of the long-term, mid-term and short-term trends, as well as the current price action, just as the Ichimoku Kinky Hyo indicator does.
The difference between the Ichimoku Kinko Hyo and the Usoho Ichi Average is that while the Ichimoku Kinko Hyo indicator mostly uses the median price of a given period as a basis for its average, the Usoho Ichi Average uses moving averages to represent trends on different horizons.
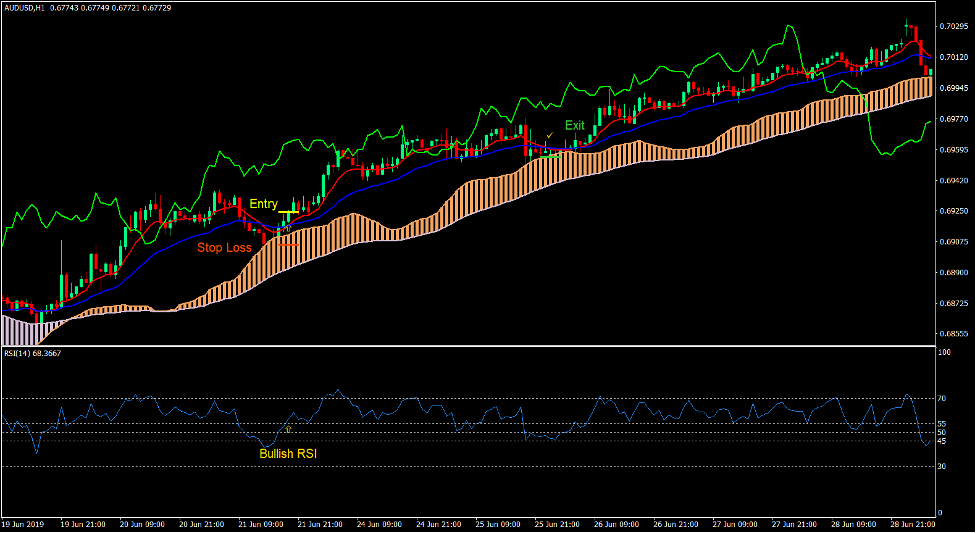
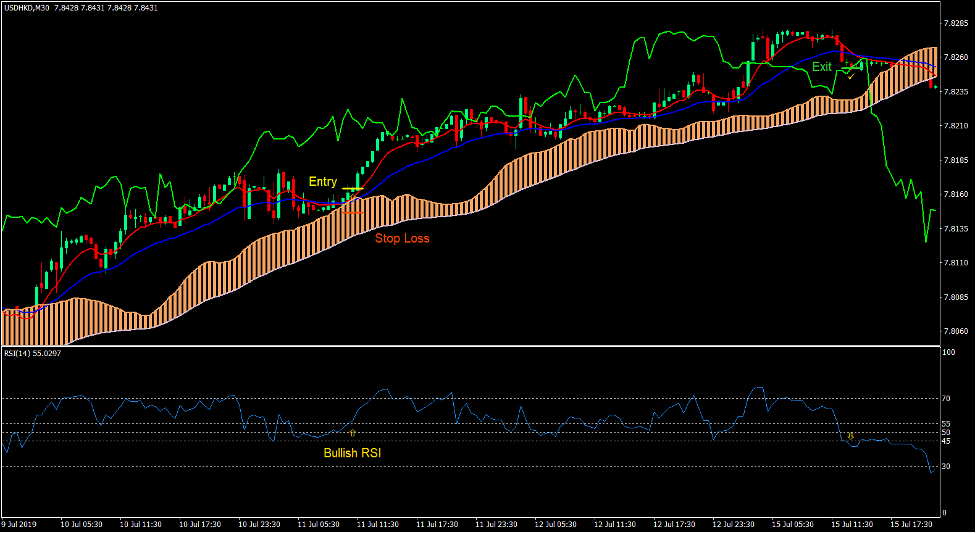
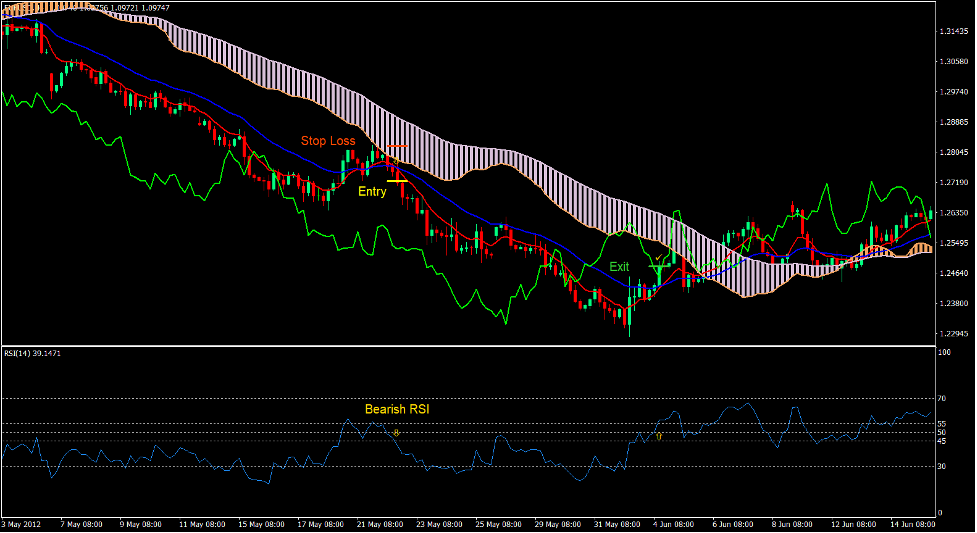
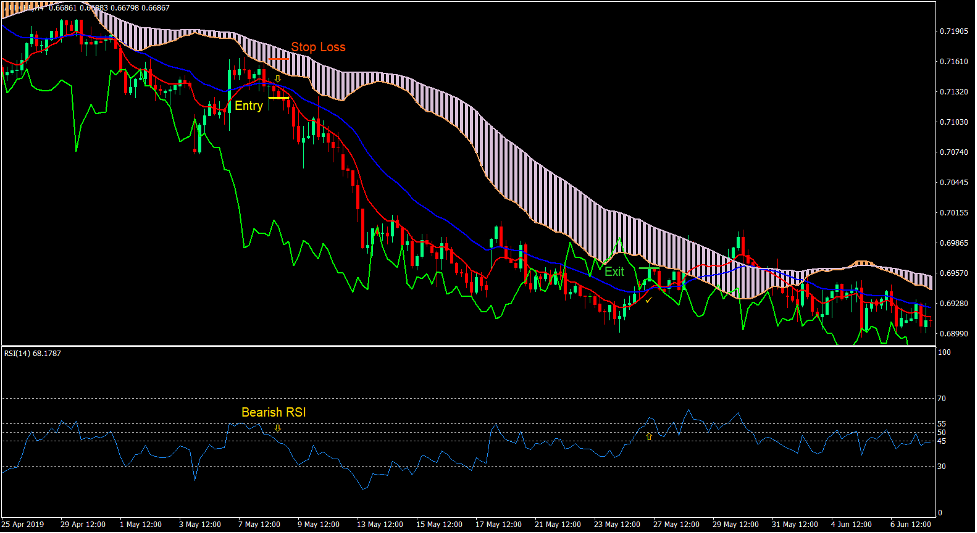
The Usoho Ichi Average is plotted with five lines. The current price action or momentum is plotted with a yellow line, which resembles the Chikou Span. The short-term trend is plotted as a red moving average line, which is called the MA Tenkan. Then there is a blue line representing the mid-term trend, which is called the MA Kijun. The last two lines represents the long-term trend area called the MA Senkou.
This indicator could be used just as a normal Ichimoku Kinky Hyo indicator would be used. If the MA Senkou is sandy brown, then the long-term trend has a bullish bias, while if it is thistle, then the long-term trend has a bearish bias.
The current trend direction is also based on how the MA Tenkan and MA Kijun overlap. If the MA Tenkan is above the MA Kijun, then the trend has a bullish bias, while if it is inversely overlapped, then the trend has a bearish bias.
If the lines are stacked clearly above each other, then the market is trending, while if the lines are crisscrossing each other, the market could have no clear direction.
Relative Strength Index
The Relative Strength Index (RSI) is one of the most popular oscillators that technical traders use. This is because the RSI is a versatile indicator which could be used to identify a variety of market conditions.
The RSI is an oscillator which is plotted within the range of 0 to 100. It usually has markers at 30, 50 and 70. These lines are used to identify market trends, momentum, and overbought or oversold conditions.
If the RSI line is above 50, then the market is said to have a bullish bias, while if the line is below 50, the market is said to have a bearish bias.
The levels 30 and 70 are used to identify oversold or overbought conditions. If the RSI line is above 70, then the market could be overbought, while if the line is below 30, then the market could be oversold.
On the other hand, momentum traders view these levels differently. The RSI line breaching above 70 could mean a bullish momentum, while an RSI line dropping below 30 could mean a bearish momentum.
Some trend traders add level 45 and 55 to help confirm trends. If the RSI line is above 55 and is respecting 45 as a support, then the trend could be bullish. On the other hand, if the RSI line is below 45 and is respecting 55 as resistance, then the trend is bearish.
Trading Strategy
This strategy uses the Usoho Ichi Average indicator to identify trending markets which are aligned on the short-term, mid-term and long-term trends, and provides trade setups based on its confluence with the RSI trend.
The Usoho Ichi Average indicator would be used to identify trending markets based on whether the lines are clearly stacked or not. If the lines are crisscrossing each other, then the pair should not be traded. Entry signals are based on the MA Tenkan and MA Kijun crossover which is aligned with the direction of the MA Senkou.
The RSI is used to confirm the trend based on its crossing over of the levels 45 or 55. These crossovers should be in confluence with Usoho Ichi Average signals.
Indicators:
- uSoho_Ichi_Average
- Relative Strength Index
Preferred Time Frames: 30-minute, 1-hour and 4-hour charts
Currency Pairs: FX majors, minors and crosses
Trading Sessions: Tokyo, London and New York sessions
Buy Trade Setup
Entry
- The MA Senkou should be sandy brown.
- Price action should generally be above the MA Senkou.
- The MA Tenkan and MA Kijun should be above the MA Senkou.
- The MA Tenkan should cross above the MA Kijun.
- The RSI line should cross above 55.
- Enter a buy order on the confluence of these conditions.
Stop Loss
- Set the stop loss on the support level below the entry candle.
Exit
- Close the trade as soon as the MA Tenkan crosses below the MA Kijun.
- Close the trade as soon as the RSI line crosses below 45.


Sell Trade Setup
Entry
- The MA Senkou should be thistle.
- Price action should generally be below the MA Senkou.
- The MA Tenkan and MA Kijun should be below the MA Senkou.
- The MA Tenkan should cross below the MA Kijun.
- The RSI line should cross below 45.
- Enter a sell order on the confluence of these conditions.
Stop Loss
- Set the stop loss on the resistance level above the entry candle.
Exit
- Close the trade as soon as the MA Tenkan crosses above the MA Kijun.
- Close the trade as soon as the RSI line crosses above 55.


Conclusion
This trading strategy works well even as a standalone trade setup. This is because the complete horizon of market is included when considering a trending market. It is a good trade strategy with a decent probability and reward-risk ratio.
The key to trading this strategy successfully is in being disciplined when it comes to filtering out non-trending markets based on the Usoho Ichi Average lines.
Forex Trading Strategies Installation Instructions
Ichi Average Strength Forex Trading Strategy is a combination of Metatrader 4 (MT4) indicator(s) and template.
The essence of this forex strategy is to transform the accumulated history data and trading signals.
Ichi Average Strength Forex Trading Strategy provides an opportunity to detect various peculiarities and patterns in price dynamics which are invisible to the naked eye.
Based on this information, traders can assume further price movement and adjust this strategy accordingly.
Recommended Forex Metatrader 4 Trading Platform
- International broker with 24/7 support.
- Over 12,000 assets, including Stocks, Indices, Forex.
- Fastest order execution and spreads from 0 pips.
- Bonuses up to $50,000 starting from the first deposit.
- Demo accounts for testing trading strategies.

Click Here for Step By Step RoboForex Trading Account Opening Guide
How to install Ichi Average Strength Forex Trading Strategy?
- Download Ichi Average Strength Forex Trading Strategy.zip
- *Copy mq4 and ex4 files to your Metatrader Directory / experts / indicators /
- Copy tpl file (Template) to your Metatrader Directory / templates /
- Start or restart your Metatrader Client
- Select Chart and Timeframe where you want to test your forex strategy
- Right click on your trading chart and hover on “Template”
- Move right to select Ichi Average Strength Forex Trading Strategy
- You will see Ichi Average Strength Forex Trading Strategy is available on your Chart
*Note: Not all forex strategies come with mq4/ex4 files. Some templates are already integrated with the MT4 Indicators from the MetaTrader Platform.
--------------------
www.forexmt4indicators.com/ichi-average-strength-forex-trading-strategy/?utm_source=rss&utm_medium=rss&utm_campaign=ichi-average-strength-forex-trading-strategy
Did you miss our previous article...
https://11waystomakemoney.com/forex/doji-candle-detection-tool-for-mt4
 Make Money OnlineForexInvestingBitcoinVideosFinancePrivacy PolicyTerms And Conditions
