Profitable trading is driven by two factors. First is the win rate, second is the reward-risk ratio. All the other factors do not matter unless a trader has a good mix of these two.
Now, there are two types of traders. There are those who prefer an excellent win rate. They are willing to have a lower reward-risk ratio as long as they are winning more often than not. On the other end of the spectrum are those who would trade only when they know they have a high reward-risk ratio. These traders often take the hit on their win rates because they are aiming for stars when trading.
High win rate traders often get small wins here and there allowing them to consistently profit from the forex markets. Some of these traders are not willing to take a hit and suffer big losses whenever they close a trade at a loss, although this could be eliminated by being disciplined with cutting losses.
High reward-risk ratio traders on the other hand often have more losses than wins. However, every now and then they get a big win and these wins are what carries them to the profitable territory.
These polar opposites are most evident with mean reversal traders and trend reversal traders. Mean reversal traders often get small wins here and there because they are often aiming for a small win, allowing price to revert to its mean. On the other hand, trend reversal traders often take trades as the market reverses. Some trade based on indicators such moving average crossovers, while others trade on trend reversal price action. Still, the results are usually the same. They often do not get it right but when they do, they win big.
Bollinger Band Mean Reversal Forex Trading Strategy is a mean reversal strategy that allows traders to profit often. Traders could get good reward-risk ratios at times but with this strategy consistency is key.
MA BBands
MA BBands is a custom technical indicator based on the moving averages and the Bollinger Bands. It is plotted on the price chart with the same characteristics as the Bollinger Bands with some differences. It has a midline which is based on a moving average and two outer bands displaced based on a standard deviation. The midline is a modified moving average which makes it behave a bit different compared to the usual Bollinger Bands. It could also be shifted left or right depending on the preference of the trader.
This indicator has a variety of uses. It could be used as trend indicator based on the moving average line. Traders could identify trend direction and bias based on the slope of the moving average line. It could also be used to identify momentum. Momentum could be identified by looking for strong momentum candles closing beyond the outer bands followed by another candle continuing the direction of the momentum candle. It could also be used as a volatility indicator. Volatility increase could be identified by the expansion of the MA BBands, while market contraction could be identified by a contracting MA BBands. Lastly, it could also be used to identify potential mean reversal setups. Price candles that are showing signs of price rejection as it touches the outer bands could indicate a possible mean reversal.
Stochastic Oscillator
The Stochastic Oscillator is a classic technical indicator used by many traders. It is mainly used to identify momentum by comparing the closing price of a trading instrument to a range of its prices over a certain period. Although it is not something new, it is still a very effective technical indicator.
The Stochastic Oscillator is plotted with two lines drawn on a separate window. The faster line is a solid line while the slower line is a dashed line. These lines oscillate within the range 0 to 100.
The Stochastic Oscillator could be used to identify trend and oversold or overbought conditions.
Having the faster line above the slower line indicates a bullish trend direction, while having the faster line below the slower line indicates a bearish trend direction.
As a mean reversal indicator, having both lines above 80 indicates an overbought market condition, while having both lines below 20 indicates an oversold market condition.
Crossovers of the two lines occurring when prices are either overbought or oversold tend to be very effective. This is because these points are confluences of a reversal occurring on an overbought or oversold condition.
Trading Strategy
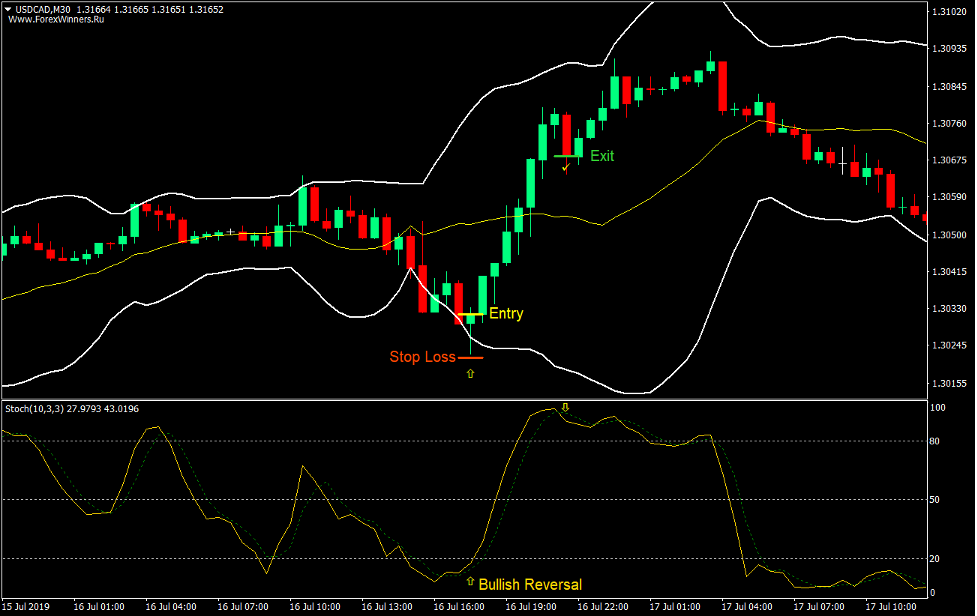
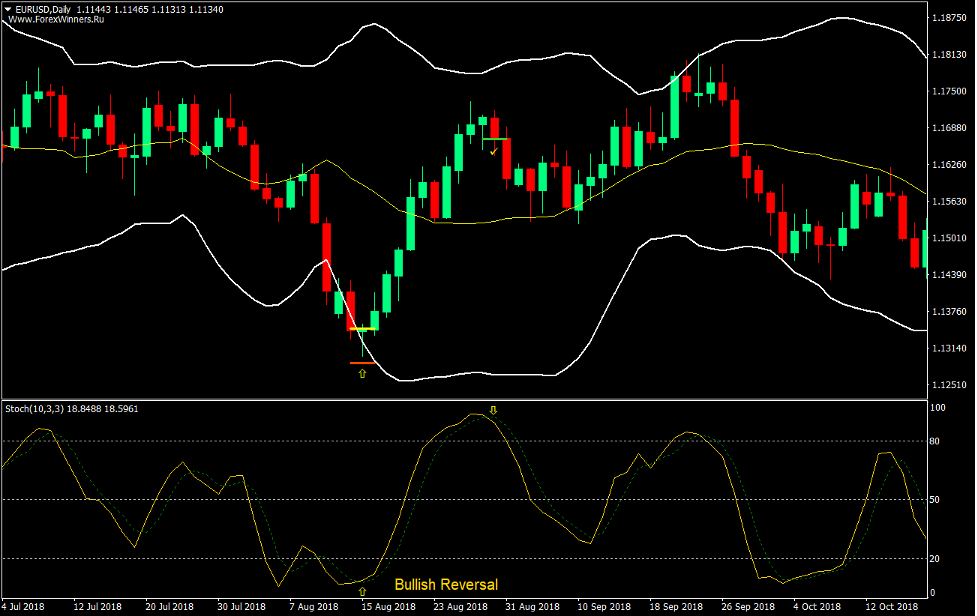
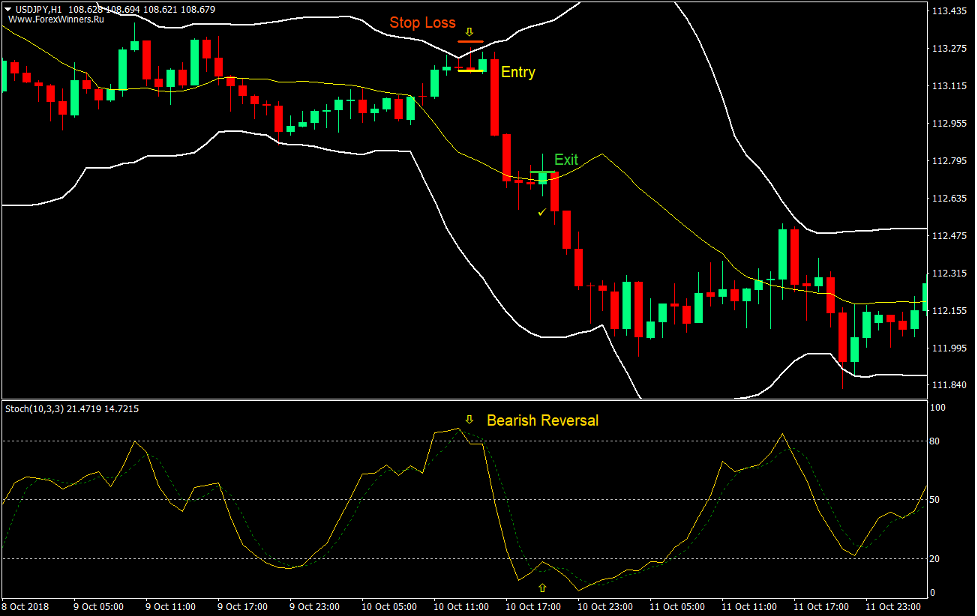
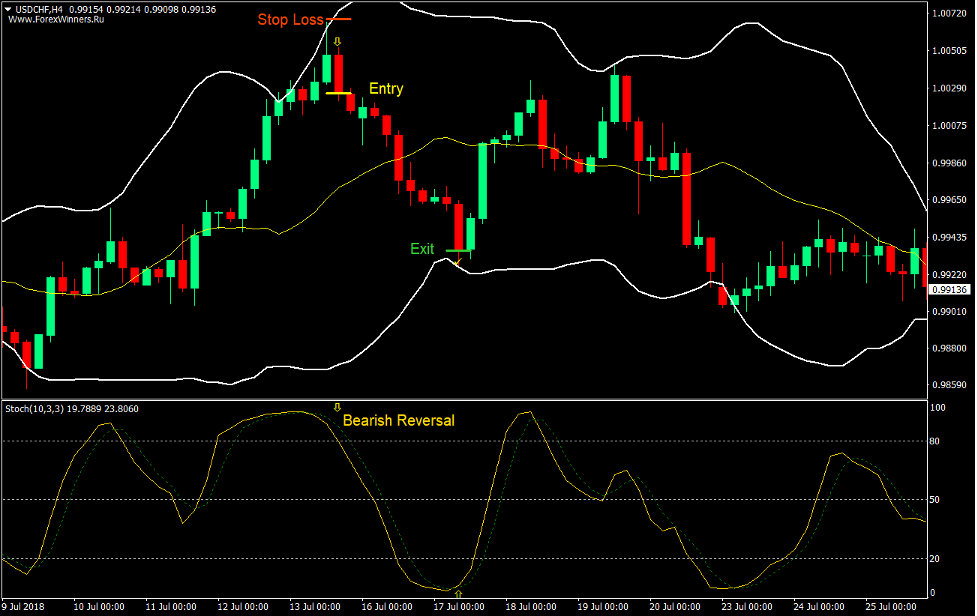
This mean reversal strategy provides trade signals based on the confluence of a reversal price action pattern and the overbought or oversold market conditions indicated by the MA BBands and the Stochastic Oscillator.
The MA BBands will be used to identify if price is on area which could be considered either oversold or overbought. This will simply be based on candles touching the outer bands.
The Stochastic Oscillator will also be used to identify overbought or oversold prices. This will be based on the lines breach 80 or dropping below 20.
If these two oversold or overbought conditions are in confluence, we will observe the chart for possible trend reversals based on reversal candlestick patterns. This could either be a pin bar, an engulfing pattern or other high probability reversal candlestick patterns.
Indicators:
- MA_BBands
- Stochastics Oscillator
- %K Period: 10
- %D Period: 3
- Slowing: 3
Preferred Time Frames: 30-minute, 1-hour, 4-hour and daily charts
Currency Pairs: FX majors, minors and crosses
Trading Sessions: Tokyo, London and New York sessions
Entry
- Price candles should be touching the lower band of the MA BBands indicator.
- The Stochastic Oscillator lines should drop below 20.
- A bullish reversal candlestick pattern should be observed.
- Enter a buy order on the confluence of these conditions.
Stop Loss
- Set the stop loss on the fractal below the entry candle.
Exit
- Close the trade as soon as the solid line of the Stochastic Oscillator crosses below the dashed line.
Sell Trade Setup
Entry
- Price candles should be touching the upper band of the MA BBands indicator.
- The Stochastic Oscillator lines should breach above 80.
- A bearish reversal candlestick pattern should be observed.
- Enter a sell order on the confluence of these conditions.
Stop Loss
- Set the stop loss on the fractal above the entry candle.
Exit
- Close the trade as soon as the solid line of the Stochastic Oscillator crosses above the dashed line.
Conclusion
This simple mean reversal strategy works well during ranging market conditions. This is because price would usually reverse to its mean every time the market detects that it is already overextended.
Having a confluence of two indicators to confirm the overbought or oversold condition increases the likelihood that price would reverse.
Most trades would result in a minor win with a decent positive reward-risk ratio. This allows traders to be consistently profitable in most market conditions.
Forex Trading Strategies Installation Instructions
Bollinger Band Mean Reversal Forex Trading Strategy is a combination of Metatrader 4 (MT4) indicator(s) and template.
The essence of this forex strategy is to transform the accumulated history data and trading signals.
Bollinger Band Mean Reversal Forex Trading Strategy provides an opportunity to detect various peculiarities and patterns in price dynamics which are invisible to the naked eye.
Based on this information, traders can assume further price movement and adjust this strategy accordingly.
Recommended Forex Metatrader 4 Trading Platform
- Free $50 To Start Trading Instantly
- Deposit Bonus up to $5,000
- Unlimited Loyalty Program
- Awards Winning Trading Broker

Click Here for Step By Step XM Trading Account Opening Guide
How to install Bollinger Band Mean Reversal Forex Trading Strategy?
- Download Bollinger Band Mean Reversal Forex Trading Strategy.zip
- *Copy mq4 and ex4 files to your Metatrader Directory / experts / indicators /
- Copy tpl file (Template) to your Metatrader Directory / templates /
- Start or restart your Metatrader Client
- Select Chart and Timeframe where you want to test your forex strategy
- Right click on your trading chart and hover on “Template”
- Move right to select Bollinger Band Mean Reversal Forex Trading Strategy
- You will see Bollinger Band Mean Reversal Forex Trading Strategy is available on your Chart
*Note: Not all forex strategies come with mq4/ex4 files. Some templates are already integrated with the MT4 Indicators from the MetaTrader Platform.
Click here below to download:
Save
Save
Get Download Access
La entrada Bollinger Band Mean Reversal Forex Trading Strategy se publicó primero en ForexMT4Indicators.com.
---------------------------------
By: Tim Morris
Title: Bollinger Band Mean Reversal Forex Trading Strategy
Sourced From: www.forexmt4indicators.com/bollinger-band-mean-reversal-forex-trading-strategy/?utm_source=rss&utm_medium=rss&utm_campaign=bollinger-band-mean-reversal-forex-trading-strategy
Published Date: Mon, 16 Aug 2021 02:42:36 +0000
Read More
 Make Money OnlineForexInvestingBitcoinVideosFinancePrivacy PolicyTerms And Conditions
